
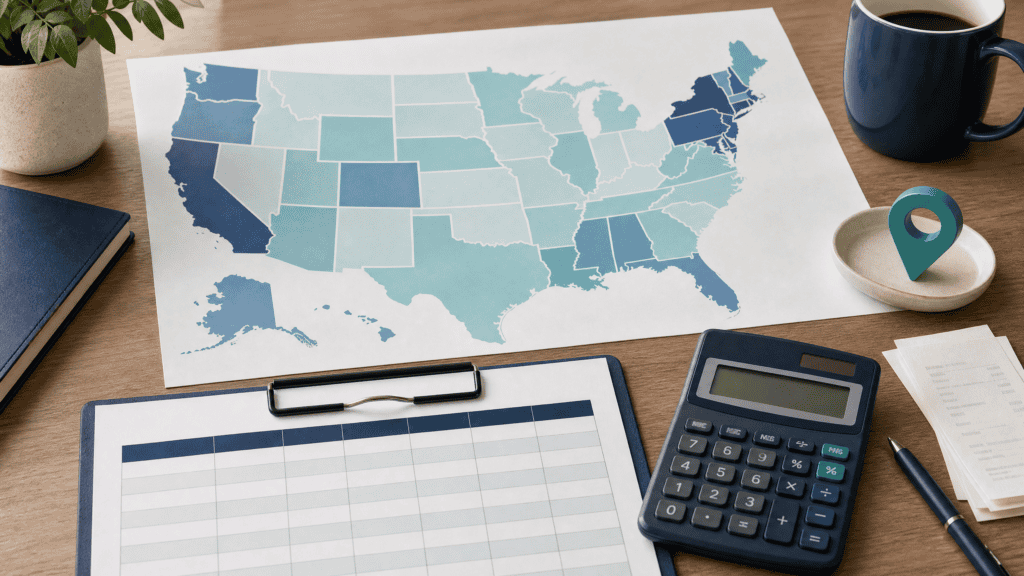
Sales tax rates by state are useful for comparing broad tax structures, but a state number is not always the rate that appears on a receipt. The final amount can include state, city, county, district or transit taxes. The correct result can depend on the address, item, delivery method and effective date.
Tax Foundation’s 2026 table reports that 45 states levy a state-level sales tax and 38 states allow local sales taxes, including Alaska.[1] It also lists average local and combined rates as of January 1, 2026. Those figures are useful for a state comparison, but an average is not a location-specific quote.
For an exact transaction, use the relevant state tax authority’s lookup. Washington provides an address, ZIP-plus-four and map lookup and describes its sales tax as destination based.[2] California provides an address map and warns that the result reflects the searched point and current rate.[3]
This guide explains how to read the comparison, why rates differ and how to check a current rate. It is general information, not a tax determination for a particular purchase or business.
Table of Contents
ToggleHow to Read Sales Tax Rates by State
A state-rate table can contain several different figures:
| Figure | Meaning |
|---|---|
| State sales tax rate | The broad statewide component |
| Average local sales tax rate | A calculated average across local jurisdictions, often weighted by population |
| Maximum local sales tax rate | The highest local component reported under the source’s definition |
| Combined state and local rate | State rate plus the source’s local rate measure |
| Exact local rate | The rate for a particular location and effective date |
Do not compare an exact city rate with a population-weighted state average as though they were the same type of number. The source definition and date must travel with the figure.
Tax Foundation’s 2026 table reports a national population-weighted average combined rate of 7.53 percent as of January 1, 2026.[1] That is a comparison statistic, not a rate for every customer in the United States.
A state can have a moderate state rate but high local additions. Another state can have a higher state rate but little or no local tax. Compare the layers before drawing a conclusion.
State Rate, Local Rate and Combined Rate
The basic relationship is:
Combined rate = State rate + Local rate + District or transit rate, when applicable
For a taxable $300 purchase at a 7.5 percent combined rate:
$300 x 0.075 = $22.50 sales tax
The total is $322.50 before other charges, discounts or special rules.
Example of a state and local layer
Texas states that its state sales and use tax rate is 6.25 percent and that local taxing jurisdictions can add up to 2 percent, for a maximum combined rate of 8.25 percent.[4] The exact local result depends on the location and current rate.
Example of a state rate with no local addition
Some states have a state rate but no general local sales-tax addition under the comparison source. That does not mean every special tax or transaction charge is zero.
Five states without a general statewide sales tax
Alaska, Delaware, Montana, New Hampshire and Oregon are listed as having no general statewide sales tax in the 2026 data.[1] Alaska can still have local sales taxes, so “no statewide tax” should not be treated as “no tax at every address.”
State rate is not taxability
A rate table cannot decide whether a service, digital product, food item, vehicle, lodging charge or business purchase is taxable. Check the state rule for the item and transaction.
2026 Rate Comparison and Important Limits
Tax Foundation’s January 1, 2026 table reports these selected figures:
| State | State rate | Average combined state and local rate |
|---|---|---|
| California | 7.25% | 8.99% |
| Florida | 6.00% | 6.98% |
| Ohio | 5.75% | 7.29% |
| Texas | 6.25% | 8.20% |
| Washington | 6.50% | 9.51% |
| Oregon | 0.00% | 0.00% |
| New Hampshire | 0.00% | 0.00% |
These are source-dated comparison figures, not live address rates. The table also reports that Louisiana, Tennessee, Washington, Arkansas and Alabama are among the states with the highest average combined rates in its 2026 comparison.[1]
Why averages can mislead
A population-weighted average gives more weight to places with more people. It does not tell you the rate in every city, county or district. A customer in a high-rate city can pay more than the state average, while another customer in a lower-rate area can pay less.
Why maximum local rates can mislead
A maximum is not a typical rate. It tells you what the source identified as the highest local component under its method. Do not use it for a normal invoice without verifying the address.
Why the date matters
A local rate can change during a year. A 2026 table published for January may not match a rate effective in July or October. Add the source date and effective date to every public table.
Why Exact Rates Depend on Location
Local boundaries do not always match city names, county names or ZIP codes. A purchase can be sourced to a store, delivery address, service location, vehicle residence or another place under state rules.
Washington says sales tax collection is based on the location where the customer receives the merchandise or service, and that the rate depends on the transaction type.[2] Its lookup accepts an address, ZIP plus four or map search.
California’s address tool says the rate shown reflects the current rate for the searched address and point, and it warns that tax rates and city and county boundary lines can change.[3]
A business should not copy a statewide rate into every invoice when it sells to multiple locations. Keep the address, rate, location code, effective date and source with the transaction record.
Online orders
For a shipped order, the delivery address may determine the rate under the state’s sourcing rule. The seller should check whether the marketplace, seller or another party is responsible for collecting tax.
Services
A service can use a different sourcing method from a physical product. The state’s guidance should control instead of a general map assumption.
Special transactions
Vehicles, lodging, rentals, admissions, fuel, digital products and food can have separate rules. A state-rate table is a starting point, not a complete taxability guide.
How to Check a Current Rate by Address
Use this workflow:
- Identify the exact delivery, store, service or use address.
- Identify the item or service category.
- Open the official state or local rate lookup.
- Review the state, local, district and transit components.
- Check the effective date and location code.
- Save the source result with the invoice.
- Recheck the rate when a new quarter or rate notice applies.
Washington provides a searchable rate table and lookup tool.[2] California provides an address map.[3] New York provides a jurisdiction and rate lookup by address, although its public page may require a security-code step for access.[5]
If a state does not offer an easy public lookup, use its current rate publications and contact information. Do not infer the rate from a neighboring city or an old receipt.
How to calculate the tax after lookup
Once the taxable price and exact combined rate are known:
Sales tax = Taxable price x Combined rate
At a $1,000 taxable price and an 8.25 percent rate:
$1,000 x 0.0825 = $82.50 tax
If the final total includes only the original price and tax, a reverse calculator can separate the pre-tax amount. It cannot choose the correct jurisdiction or decide whether the purchase is taxable.
Common Questions About State Sales Tax Rates
Which state has the highest sales tax rate?
The answer depends on whether you mean the state-level rate, average combined rate or a particular local rate. Tax Foundation’s 2026 table reports California as having the highest state-level rate at 7.25 percent, while combined averages differ because of local taxes.[1]
Which states have no statewide sales tax?
Alaska, Delaware, Montana, New Hampshire and Oregon have no general statewide sales tax in the cited 2026 comparison. Alaska can still have local sales tax.[1]
Is the average combined rate my exact rate?
No. An average is a comparison figure. Use an official address lookup for an exact location.
Why can rates differ inside one state?
Cities, counties, districts and transit authorities can add local components. Boundaries and effective dates also differ.
How do I find sales tax by ZIP code?
Use the official lookup for the state. A full address or ZIP-plus-four may be more precise than a five-digit ZIP because ZIP boundaries can cross taxing jurisdictions.
Does the delivery address matter?
It can. Washington states that the customer’s receipt location helps determine the rate for destination-based transactions.[2] Other states can use different sourcing rules.
Can I use a rate from a receipt for a new purchase?
Not automatically. Check the new location, date, taxable item and applicable rate.
Does a sales-tax table tell me if an item is taxable?
No. Taxability and rate are separate questions.
How often should a business update its rates?
Review the official source on its published schedule and whenever a rate-change notice arrives. At minimum, confirm the rate before each new reporting period when the state updates quarterly.
Sales tax rates by state are useful for comparison, but the number on a real receipt usually requires a location and date. Start with the state component, add the applicable local layers, verify the address through an official lookup and preserve the source used.
Internal links for publishing
| Suggested anchor | Destination |
|---|---|
| California sales tax | https://reversesalestax.com/states/california-sales-tax/ |
| Texas sales tax | https://reversesalestax.com/states/texas-sales-tax/ |
| Ohio sales tax | https://reversesalestax.com/states/ohio-sales-tax/ |
| states without statewide sales tax | https://reversesalestax.com/states-with-no-sales-tax/ |
| reverse sales tax calculator | https://reversesalestax.com/ |
Writer and publisher QA
| Check | Status |
|---|---|
| One H1 only | Pass in article structure |
| H2 count below 10 | Pass: 6 article H2 headings |
| H3 to H6 hierarchy | H3 used for comparison limits, examples and FAQs |
| Generic rate ownership | State-rate hub owns the broad phrase |
| Table date | January 1, 2026 source date included |
| Average versus exact | Explicitly distinguished |
| Address lookup | Washington and California examples included |
| Rate freshness | Update table before publication and after rate changes |
| Forbidden words and symbols | Run against the saved anti-AI rules file |
| Feature image | Generate and inspect before upload |
| Similarity review | Run against source pages and current site posts |
| Responsive review | Test after WordPress publication |
Sources
Source links used for this article are listed below. Rules and rates can change, so check the relevant official guidance for current details.
- Tax Foundation, State and Local Sales Tax Rates, 2026.
- Washington Department of Revenue, Sales and Use Tax Rates.
- California Department of Tax and Fee Administration, Find a Sales and Use Tax Rate.
- Texas Comptroller, Sales and Use Tax.
- New York Department of Taxation and Finance, Jurisdiction/Rate Lookup by Address.

1 thought on “Sales Tax Rates by State and Local Rate Differences”
Pingback: Reverse Sales Tax Excel Template for Tax Receipts | ReverseSalesTax.com